4 Electrolytic plotting tank
4.1 Chosen instrument
Electrolytic plotting tank / potential trough with a Voltaic pile as historical power source.
4.2 Learning objectives of the project
Students will investigate how electric potential varies in a conducting liquid and how equipotential lines can be mapped experimentally. They will understand that an LED lights only when there is sufficient potential difference and correct polarity between its two leads. They will connect the activity to historical analogue instruments used for mapping electric fields before computer simulations, and to Volta’s pile as an early source of continuous electric current.
4.3 Reconstruction of the instrument?
Students first reconstruct a simple Voltaic pile from alternating metal pairs and electrolyte-soaked separators. Students build a shallow electrolytic tank using a non-conducting container, tap water or hot drinking water from a drinking-water dispenser, and two electrodes. In our prototype, the LED effect was visible in tap water and in hot drinking water, but adding salt reduced the measured voltage in the liquid and made the LED effect weaker. This unexpected result becomes part of the inquiry: students investigate why increasing conductivity is not always beneficial when the source is a weak battery or a Voltaic pile with significant internal resistance.
4.4 Construction instructions
4.4.1 Materials
- non-conducting shallow container;
- tap water or hot drinking water;
- two electrodes, for example aluminium foil as an outer electrode and a copper strip or graphite rod as the inner electrode;
- two 9 V batteries in series or another safe low-voltage DC source;
- optional Voltaic pile / coin battery as historical source;
- red LEDs as visual probes;
- wires with crocodile clips;
- multimeter;
- optional foam or cork to hold the LED floating.
4.4.2 Step-by-step reconstruction
Place an aluminium foil strip along the side or bottom edge of the non-conducting container. This forms one electrode.
-
Place a copper strip, copper wire, or graphite rod in the middle of the container. This forms the second electrode (figures 4.1 on the page and 4.2 on the page ).
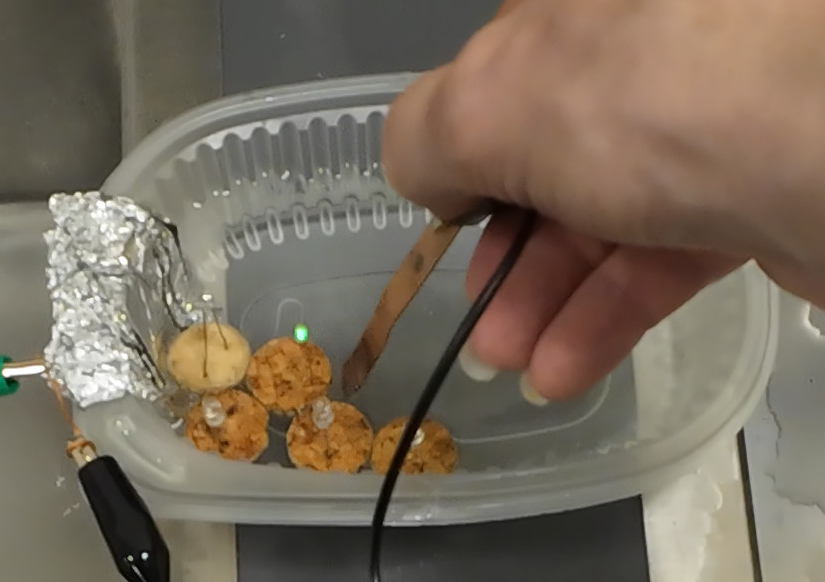
Figure 4.1: A light emitting diode did lid up using a copper plate.
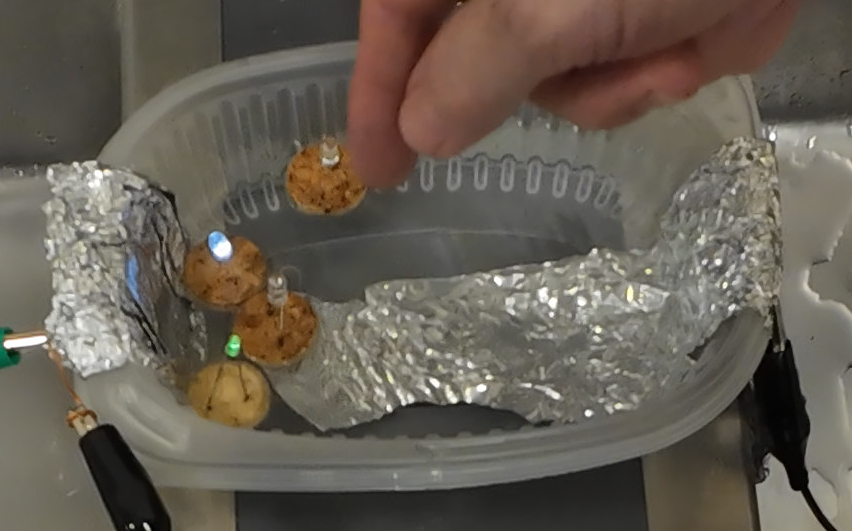
Figure 4.2: Aluminum foil for both electrodes seemed to work better than a narrower copper plate.
Add tap water or hot drinking water. Do not start with salt water, because in our prototype salt made the liquid too conductive for the 9 V batteries and reduced the voltage under load.
Connect the outer electrode to one terminal of the low-voltage source and the inner electrode to the other terminal.
-
Prepare the LED probe by bending the LED leads apart. Optionally, attach the LED to a small piece of foam or cork so that the leads remain in the water(figure 4.3 on the page ).
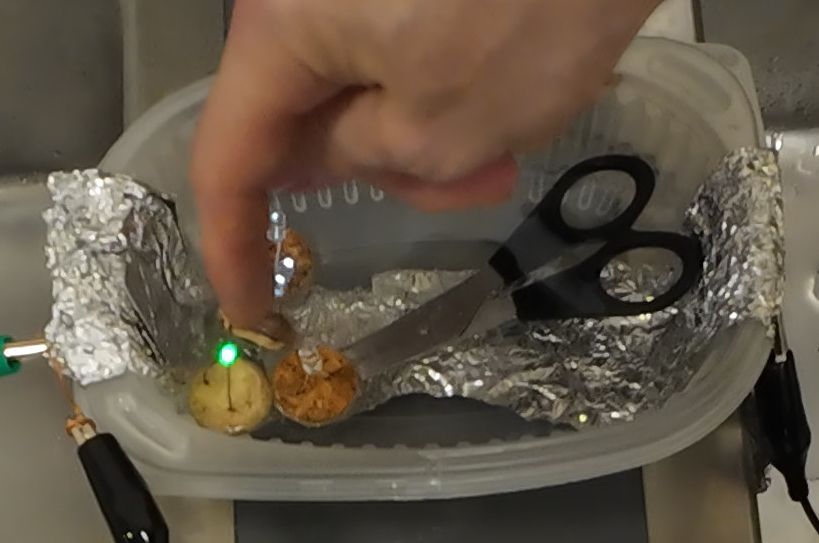
Figure 4.3: Something heavy can hold the aluminum foil down in order to avoid it to touch any diode.
Move the LED probe between the two electrodes. Rotate it and reverse its polarity.
Observe where the LED shines brightly, shines weakly, or goes out.
-
Use a multimeter to measure the potential difference between selected points in the water (figures 4.4 on the page and 4.5 on the page ).
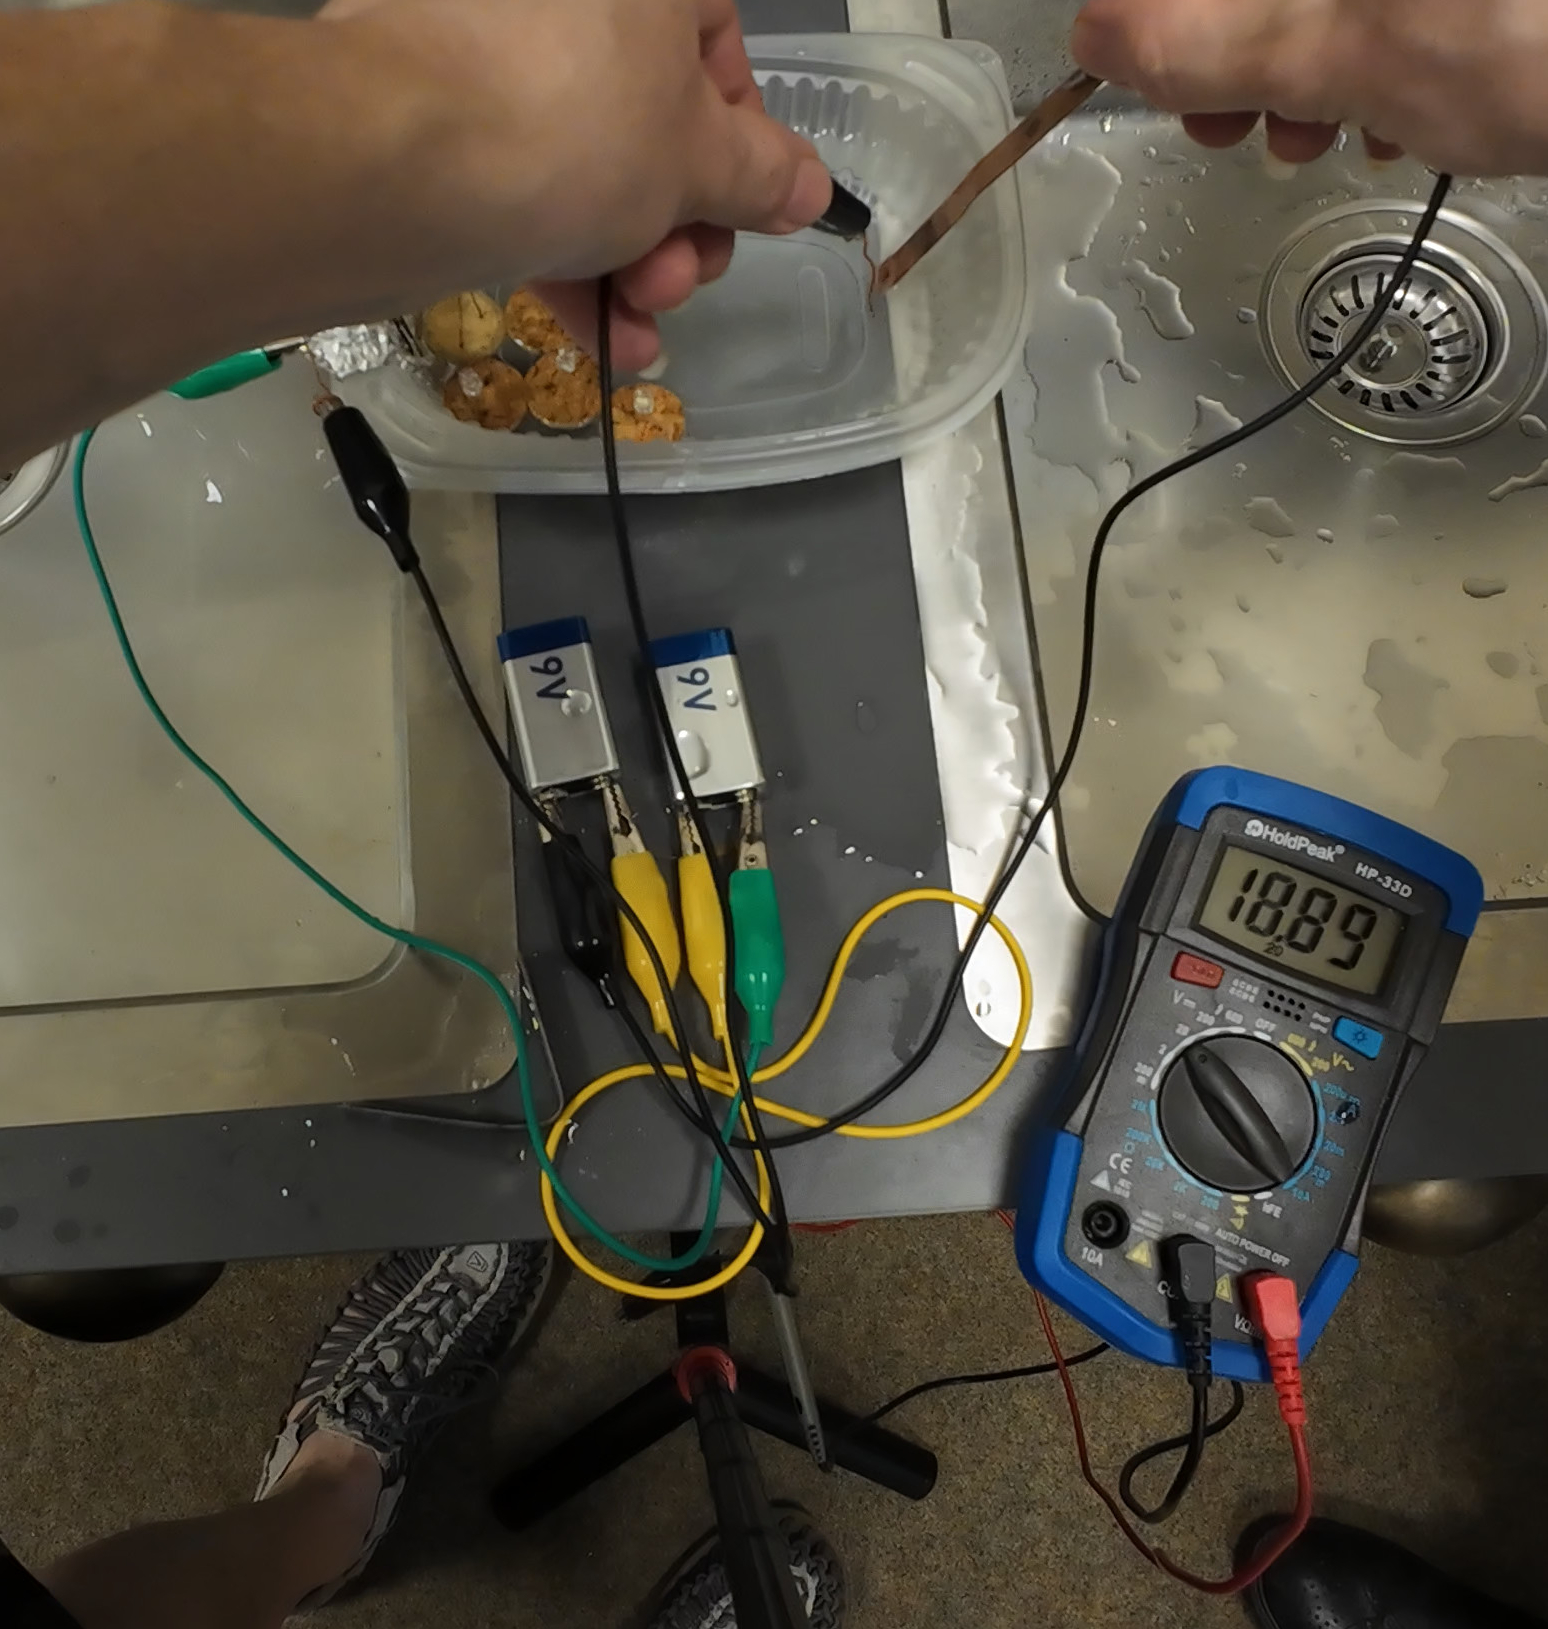
Figure 4.4: If the distance was larger between the electrodes, the voltage between them was higher.
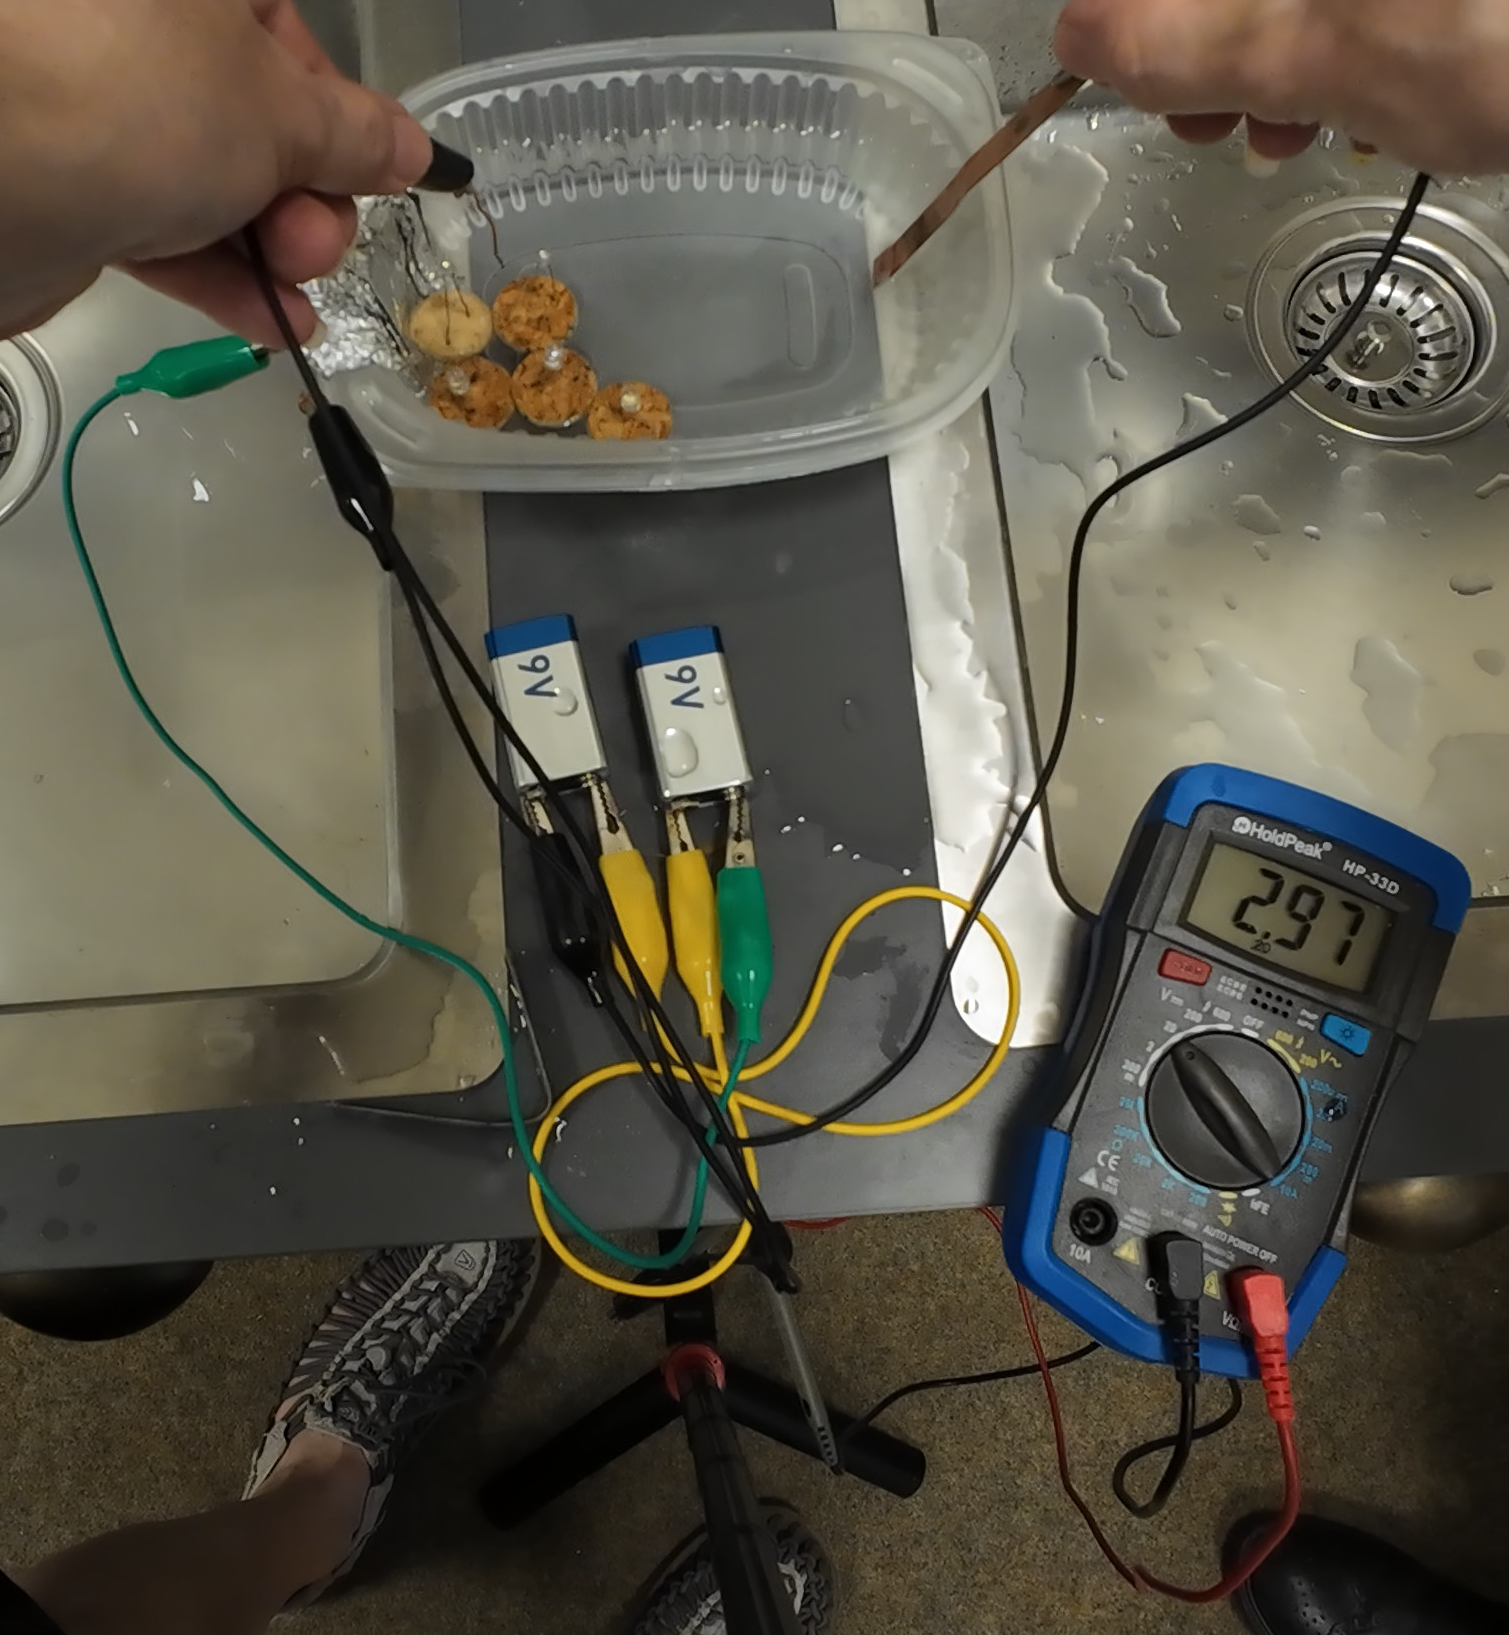
Figure 4.5: If the distance was shorter between the electrodes, the voltage between them was lower.
Repeat the test with different liquids: tap water, hot drinking water, weak salt solution, and stronger salt solution.
Compare the results and discuss why increasing conductivity does not necessarily improve the effect when the power source has significant internal resistance.
4.5 Activities that actively engage students
Students predict where the LED will light, move it through the liquid, rotate it, reverse its polarity, and map regions where it shines, dims, or goes out. They then infer equipotential lines from their observations. Instead of being told the answer, they discover that brightness depends on the potential difference between the LED’s two leads, not simply on “how much current there is in the water.”
4.6 How is the instrument central?
The instrument is not just a demonstration. It is the method of investigation. Students use it to produce evidence: they create a map of the electric potential pattern in the tank. The historical instrument therefore becomes an epistemic mediator: it shapes what can be observed and how knowledge is produced.
4.7 Scientific knowledge
The key idea is that electric fields and electric potential differences are invisible, so scientists need instruments and representations to make them investigable. Students experience how knowledge is constructed through designing a setup, observing, recording, interpreting, correcting errors, and comparing different probe positions.
They also see that the instrument does not give neutral or automatic access to nature. The result depends on electrode shape, water conductivity, power source, LED colour, polarity, and measurement method. In our prototype, adding salt reduced the measured voltage in the liquid, probably because the solution became too conductive for the 9 V batteries and the source voltage dropped under load. Therefore, the instrument makes visible not only electric potential in the liquid, but also the limitations of the measuring system itself.
4.8 Historical link
Volta’s pile represents the early history of continuous electric current. The electrolytic tank represents a later historical analogue method for studying potential fields before digital simulation. The project therefore links two historical stages: producing electric current and using controlled electric systems to investigate invisible fields.
4.9 Interdisciplinary connections
Physics: voltage, current, resistance, polarity, electric field, equipotential lines. Chemistry: electrolytes, ions, conductivity of tap water and salt solutions, electrode reactions. History of science: Volta, early electricity, analogue instruments before computers. Technology/engineering: instrument design, reliability, calibration, limitations. Art/representation: students draw a “map” of invisible electric potential, similar to how scientific drawings convert observations into communicable knowledge.
4.10 Connection to art
Students can produce a visual map of the tank: zones where LEDs shine brightly, dimly, or not at all. This connects to scientific visualization: invisible phenomena become visible through instruments and drawings.
4.11 Creativity
Creativity appears in the design of the probe, the choice of electrode geometry, and the historical reconstruction. Students can compare different electrode shapes: point–ring, two plates, two wires, asymmetric shapes. They can ask: how does the field pattern change when the instrument is redesigned?
4.12 Assessment opportunity
Assessment can be based on a short lab report or poster where students must include: prediction, sketch of setup, observations, voltage measurements, inferred equipotential lines, explanation of LED brightness, and reflection on the historical instrument’s role and limitations.
4.13 Lesson plan
The lesson plan is presented as the table 4.1 on the page .
| Activity | Objective | \(\frac{\text{Duration}}{\unit{\min}}\) |
|---|---|---|
| Introduction: invisible electric fields and historical instruments. | Understand why instruments are needed to investigate invisible phenomena; introduce Volta pile and electrolytic plotting tank. | 10 |
| Build or inspect a Voltaic pile. | Connect the activity to early continuous-current sources; identify metal pairs, electrolyte, and series connection. | 15 |
| Build the electrolytic tank | Set up electrodes, conducting liquid, and safe low-voltage circuit; discuss why the container should be non-conducting. | 10 |
| Prediction task | Students predict where an LED will shine, dim, or go out; formulate inquiry questions. | 5 |
| LED probe investigation | Move and rotate LEDs in the electrolyte; test polarity and position; observe brightness changes. | 20 |
| Voltage measurements | Use a multimeter to measure potential differences between selected points and compare with LED behaviour. | 15 |
| Mapping equipotential regions | Draw a map of bright/dim/off regions and infer possible equipotential lines. | 15 |
| Historical reflection | Compare LED probe with historical probing methods in electrolytic tanks; discuss instruments as mediators of knowledge. | 10 |
| Group explanation / poster | Students explain how the instrument works and what limitations affected their results. | 15 |
| Assessment / exit ticket | Individual explanation: “Why does the LED go out in some orientations?” and “What makes this a historical scientific instrument activity?” | 5 |
The table 4.3 on the page lists the versions of the tank.
| Version | Liquid | Purpose |
|---|---|---|
| A. | tap water | baseline; worked in our prototype |
| B. | hot drinking water | worked in our prototype; compare possible effects of temperature and dissolved ions |
| C. | weak salt solution | test whether conductivity improves or overloads the source |
| D. | stronger salt solution | observe voltage drop and limitations of batteries |